Dashboard
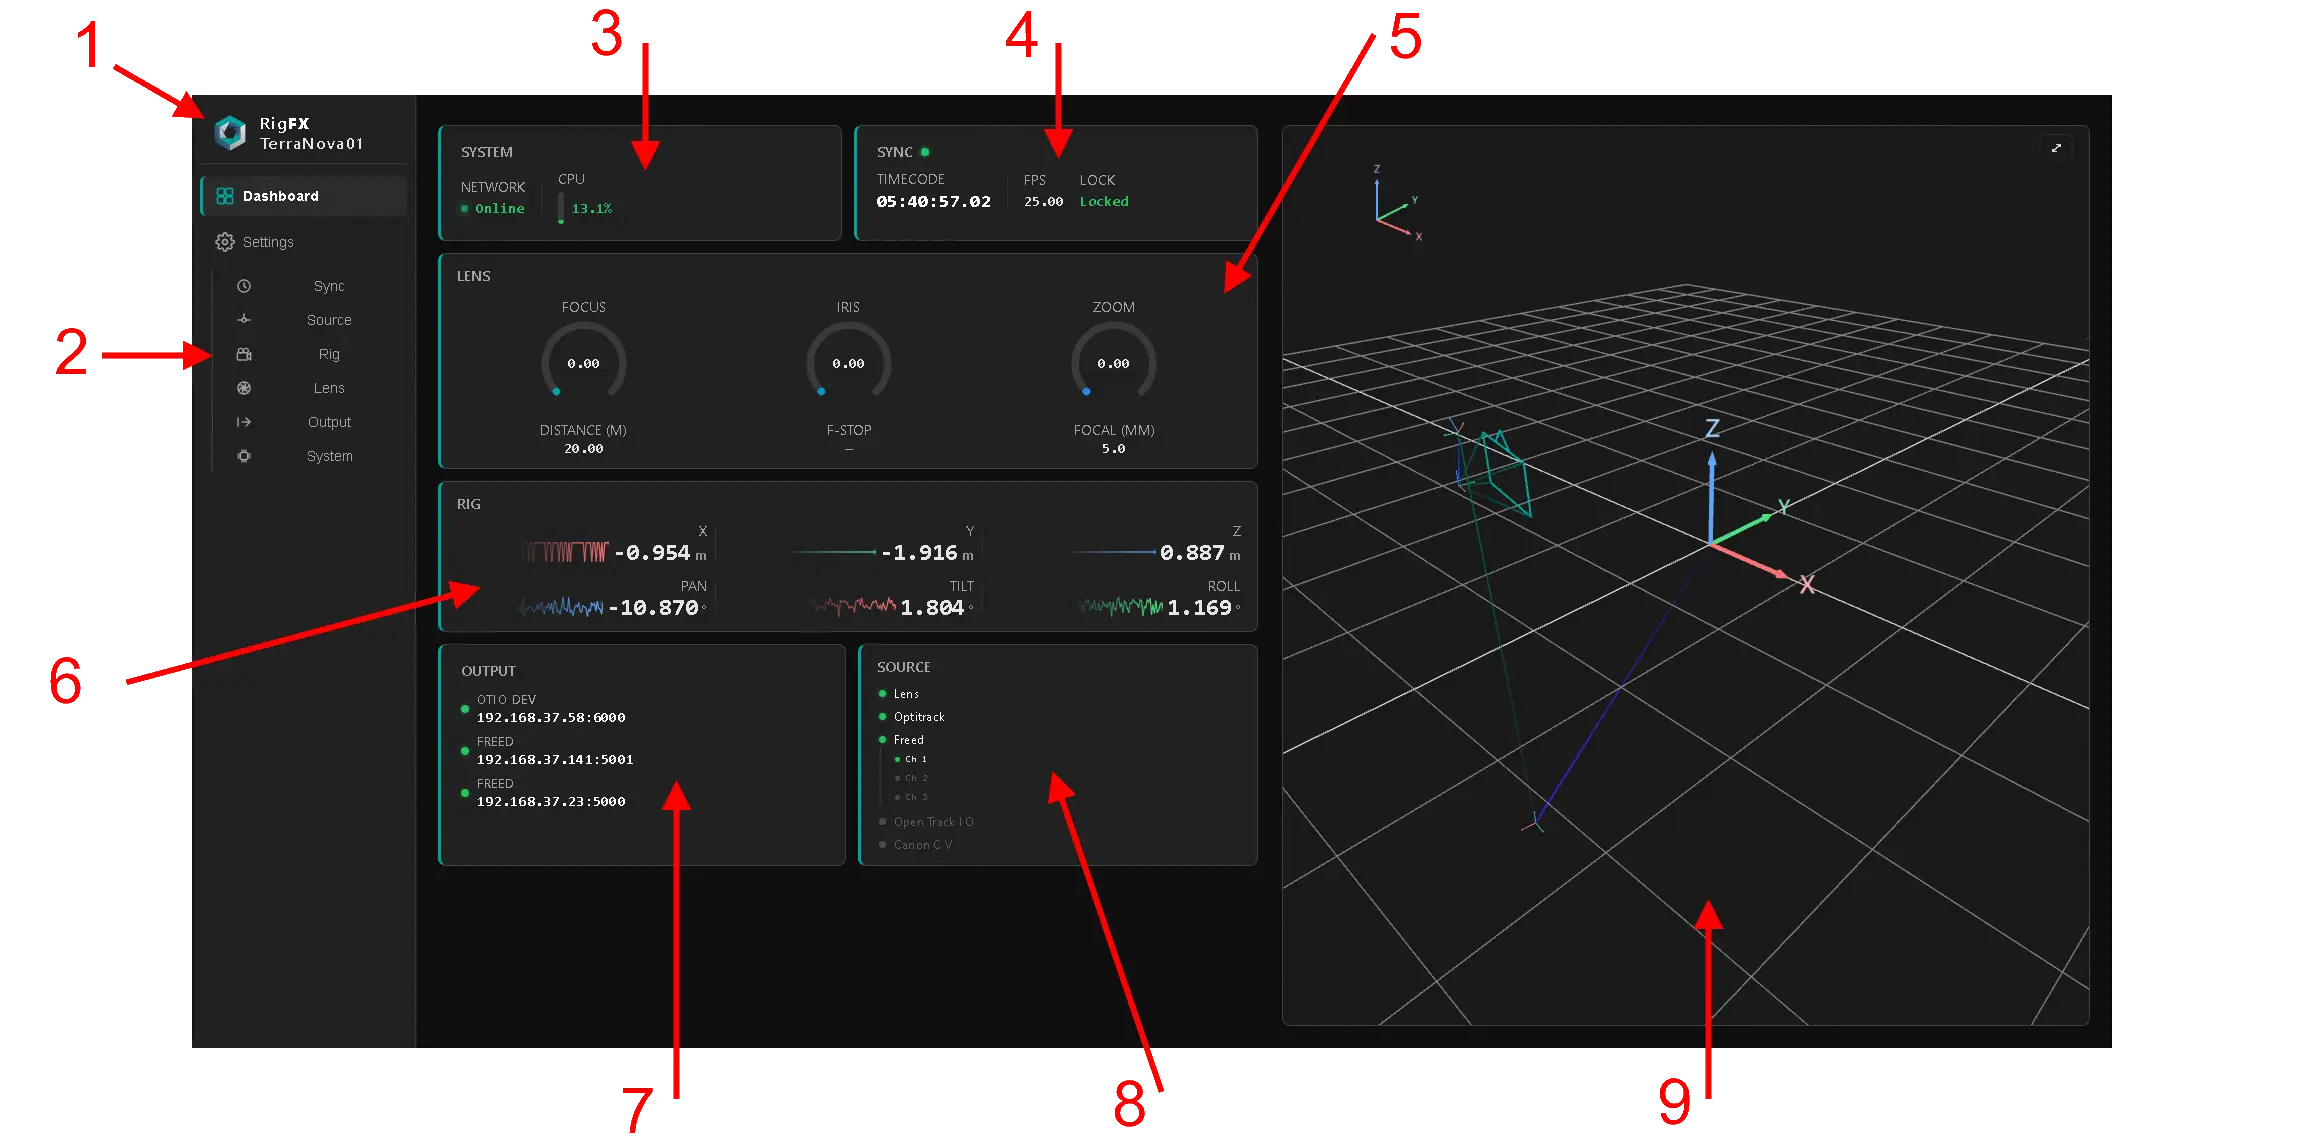
The Dashboard is the landing page of the web app — it summarises every signal so you can confirm RigFX is healthy at a glance.
| # | Area | Purpose | Click action |
|---|---|---|---|
| 1 | Device name | RigFX display name. | Opens System to edit it. |
| 2 | Side menu | Navigation to every subpage. | Jumps to the chosen page. |
| 3 | System info | CPU / load — confirm the system is not overloaded. | Opens System. |
| 4 | Sync quick view | System timecode and genlock lock state. | Opens Sync. |
| 5 | Lens quick view | FIZ encoder values and key resolved lens parameters. | Opens Lens. |
| 6 | Rig quick view | 3D position of the camera. | Opens Rig. |
| 7 | Output status | Currently active camera tracking output stream and target. | Opens Output. |
| 8 | Sources status | All active sources at a glance. | Opens Source at the clicked source. |
| 9 | 3D viewer | Interactive 3D view of the camera position in real time. | — |
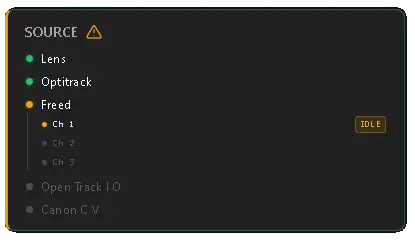
When something is wrong
The Dashboard is also the fastest place to spot a problem. A warning symbol appears on any card with :
- a misconfiguration,
- a disconnected source, (see example below with issue on Freed source)
- or any other fault.
So the operator can immediately see where an error is coming from.